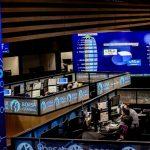


Borsa İstanbul Perşembe Gününe Yükselişle Başladı: Yatırımcıların Gözü Veri Gündeminde
Borsa İstanbul’da BIST 100 endeksi, Perşembe gününe yüzde 0,36 yükselişle 9.564,85 puandan başladı. Açılışta önceki kapanışa göre 34,38 puan ve yüzde 0,36 değer kazanan endeks, dünkü kayıplarının bir kısmını telafi…
Çin Merkez Bankası Faiz Oranlarını Sabit Tuttu, Likiditeyi Yönetti
Çin Merkez Bankası (PBoC), 1 yıl vadeli borçlanma faizi oranını (politika faizi) sabit tutarak piyasalardaki ihtiyatlı para politikasını sürdürüyor. Banka, Orta Vadeli Kredi Aracı (MLF) ile piyasaya aktardığından daha fazla…
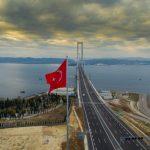
Osmangazi Köprüsü’nde Rekorlar Kırılıyor: 117 Bin 537 Araç Geçişi!
İstanbul-İzmir Otoyolu’nun Kalbi Osmangazi Köprüsü’nde Geçiş Rekorları Devam Ediyor Ulaştırma ve Altyapı Bakanı Abdulkadir Uraloğlu’nun da açıkladığı gibi, 13 Nisan 2024 Cumartesi günü Osmangazi Köprüsü’nden 117 bin 537 araç geçişi…
Borsa İstanbul Tarihe Geçti: BIST 100 Endeksi Rekorları Alt Üst Etti
BIST 100 Endeksi Tüm Zamanların En Yüksek Seviyesini Gördü Borsa İstanbul’da (BIST) 8 Nisan 2024 günü tarihi bir kapanış gerçekleşti. BIST 100 endeksi, günü yüzde 1,43 değer kazancıyla 9.756,69 puandan…
Borsa İstanbul’da Halka Arz Heyecanı Devam Ediyor: 2024’ün İlk Çeyreğinde 9 Şirket Borsa’ya Katıldı
Borsa İstanbul, 2024 yılının ilk çeyreğinde de halka arzlara ev sahipliği yapmaya devam etti. Yılın ilk üç ayında 9 şirket halka arz olurken, bu şirketlerden 5’i yıldız pazarda, 3’ü ise…
İstanbul Havalimanı Bayram Yoğunluğunda Zirvede!
Ramazan Bayramı’nı da kapsayan 9 günlük tatil öncesinde İstanbul Havalimanı, 222 bin 72 yolcuya ev sahipliği yaparak bayram yoğunluğunda zirveye ulaştı. Dün 1512 uçuşla gerçekleşen bu yoğunluk, bugün de devam…
Cari Açık 2023’te 45 Milyar Dolar!
Merkez Bankası’nın açıkladığı verilere göre, 2023 yılı cari işlemler açığı 45 milyar dolar olarak gerçekleşti. Bu rakam, 2022’ye göre yüzde 9’luk bir düşüş gösteriyor. Aralık ayı cari işlemler açığı ise…
Bitcoin 65 Bin Doların Altında! Kripto Para Piyasası Endişeli
Kripto para piyasası son 24 saatte sert bir düşüş yaşadı. Bitcoin, ABD Merkez Bankası’nın (Fed) gelecek adımlarına ilişkin belirsizliklerle birlikte 65 bin doların altına geriledi. Analiz şirketi Coinmarketcap’in verilerine göre,…
Emeklilerin Bayram İkramiyeleri Hesaplarda! 3 Bin Liraya Çıkan İkramiyeler Ne Zaman Yatacak?
Müjdeli haber emeklilere: 3 bin liraya yükseltilen bayram ikramiyelerinin ödemeleri yarın başlıyor! Yaklaşık 16 milyon emekli, zamlı ikramiyelerini aylıklarını aldıkları hesaplara yatırılacak. İşte İkramiye Ödeme Takvimi: SSK Emeklileri: Maaşını ayın…
Küresel Piyasalar: Belirsizlik Hakimiyet Kuruyor, Fed ve Merkez Bankaları Odak Noktasında
Küresel piyasalar, ABD’de açıklanacak önemli ekonomik veriler ve merkez bankalarının faiz indirimi planlarına yönelik belirsizliklerle karmaşık bir seyir izliyor. Yatırımcılar, enflasyon ve faiz oranları arasındaki dengeyi anlamaya çalışırken, jeopolitik riskler…